Teaching Mean, Median, and Mode? Try these creative ideas!

Mean, median, and mode (measures of central tendency) can easily be made relevant and meaningful for students. Instead of simply giving students sets of numbers and having them calculate the mean, median, and mode with no real-life relevance, there are many activities you can do that will engage your students and make it easier to remember the difference between the three measures.

But first, what are mean, median, and mode?

Mean, median, and mode are measures of central tendency, or ways to describe the central value of a data set. Although mean,  median, and mode are all ways of describing central values, certain ones work better than others in different situations.
 

Mean (or average)

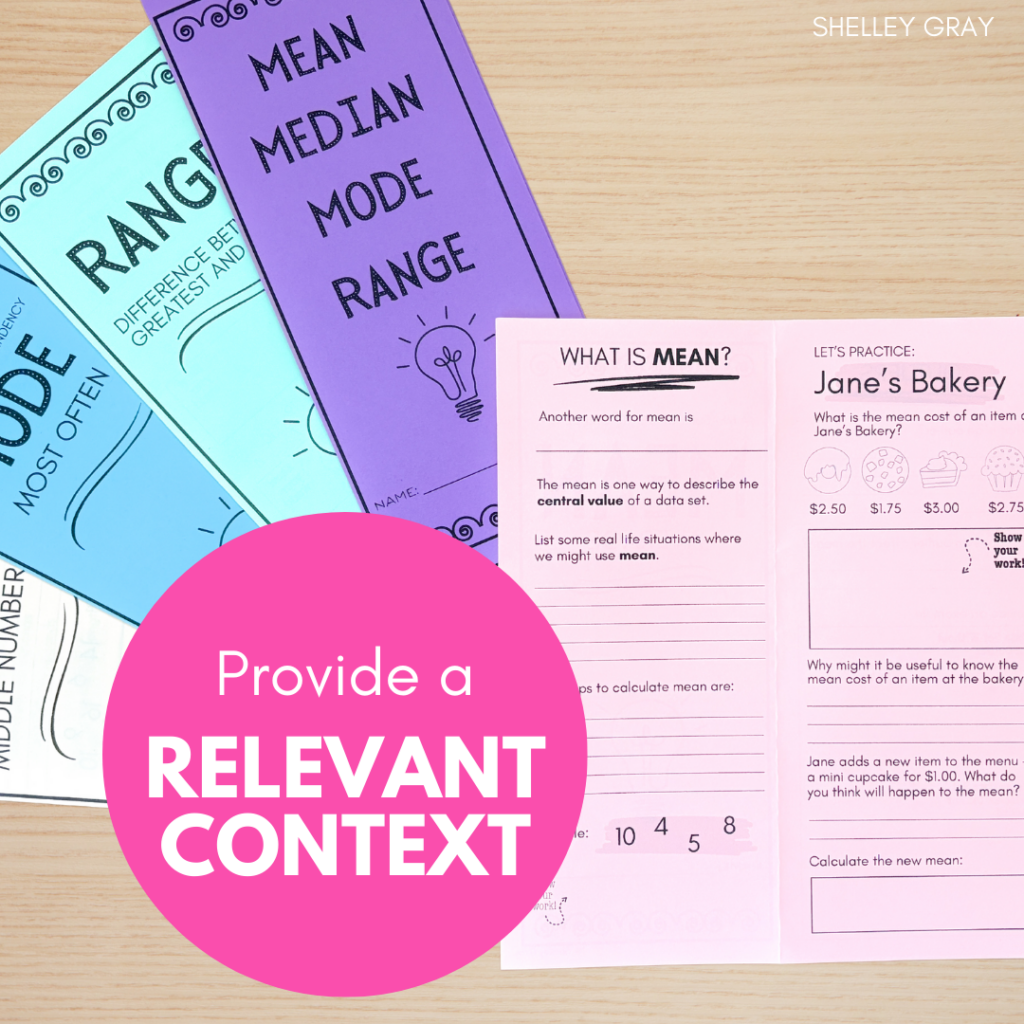
Mean is typically the measure that we are most familiar with. We use averages all the time in real life, such as average points in a baseball game, average costs for a concert ticket, or average time it takes to walk to school.

The mean is calculated by adding all the values and dividing the sum by the total number of values. For example, if a data set is made up of the numbers 4, 2, 6, and 8, the mean is calculated as follows:

(4+2+6+8) /4 = 5  

Median (or middle number)

The median is the middle number when a set of values is arranged from smallest to largest. For example, in the data set 4, 2, 8, 5, 1 we arrange them from smallest to largest: 1, 2, 4, 5, 8. The middle number is 4, so the median is 4. If there are an even number of values, there will be no middle number; in that case we choose the two middle numbers and figure out the mean of those two numbers.
 

The median is a particularly good measure to use when there is an outlier in the data set. For example, if we are calculating the average ages of people in the classroom using these ages: 12, 13, 13, 12, 13, 12, 14, 12, 13, 45, the mean will be 15.9. This is not an accurate representation of the ages of the people in the room; the outlier (45) has skewed the mean. The median, on the other hand, is 13, which is a much more accurate measure.

Mode (most often)

The mode is the value that appears most often in a data set. For example, in this data set: 4, 1, 2, 6, 1, 7, 1, the mode is 1. In real life, this is a useful measure when looking at categories of data, such as most common car color or most popular shoe size.
 

HOW TO TEACH MEAN, MEDIAN, AND MODE

Here are some creative ideas for teaching mean, median, and mode that will engage your students and help them realize how these measures are useful in real life.
 

Watch This Video 

I love Math Antics videos for explaining math concepts in an easy-to-understand way. This video on Mean, Median, and Mode will be a valuable supplement in your classroom.

mean median mode video
 Sports Cards

Bring measures of central tendency to life with sports statistics! Bring a collection of hockey or baseball cards. Have students use the statistics on the back of the card to calculate mean, median, or mode. For example, students can calculate average points per season, average goals, or average assists.


Survey classmates 

Have students choose their own topic and create a survey. Then use the data collected to calculate mean, median, or mode. Examples might include favorite color, age, number of siblings, or distance between the school and their home. Discuss which measure makes the most sense for each survey. For example, mode is the best way to describe students’ favorite colors.


Local Real Estate

Look at a real estate website or print out a few listings; have students calculate the mean or median house prices. Talk about which is a better measure of the central value and why. This will depend if there are outliers or not. For example, if most houses in an area cost $120,000 but there is one that costs $500,000, this outlier would skew the mean house price. In this scenario, median might be a better measure of central tendency.


Student Heights

Have students line up according to height and calculate the median height. Contrast it to the mean and mode and discuss which is a better measure.


Provide Relevant Scenarios

Learning is always most effective when students can relate it to their real-life experiences. Why do mean, median, and mode matter in real life? When would we actually use them? These central tendency brochures help students understand real-life uses for each measure and serve as a reference guide. 

Sorting and Graphing Candy

Distribute bags of colored candies to students. Have them sort and graph the candies by color. Then arrange the class into groups of 3-5 students. Using their data, have them calculate the mean, median, and mode for each color of candy. Alternatively, use the data from the entire class to calculate the measures of central tendency.

MEAN MEDIAN MODE CANDY

Paper Bag Mode

Write numbers, colors, items, or anything else on slips of paper and put them in a paper bag or hat. As a whole class, have each student draw a paper out of the hat or bag, and graph which one they chose. After a student chooses, have them replace the paper. Once all students have chosen, identify the mode (the one that was chosen most often).


Mean, Median, and Mode Puzzles and Practice

Once students have an understanding of what mean, median, and mode means and when each of them can be used, provide extra practice with puzzles or task cards. These types of activities are best-suited to practicing the calculations once students already possess a solid understanding of the concept.

Incorporate a Math Project for Real-Life Context

Math projects are a fantastic way to help students understand where math is used in real life. In this math project, your students will use their understanding of mean, median, and mode to figure out where a baseball stadium needs to make changes in order to be more profitable. This particular project is best-suited to Grades 6-8.

Math-Project

Incorporate Music

    • Have students choose three of their favorite songs, and calculate the mean and median song length. How do they compare?
 

Take the Learning Outdoors!

Get outside and record lengths of leaves, distances, colors of vehicles, etc. Use the data to calculate mean, median, mode, and range.

Mean Median Mode Unit

Check out this bundle of done-for-you activities for your central tendency unit.

Leave a Reply

Your email address will not be published. Required fields are marked *

This site uses Akismet to reduce spam. Learn how your comment data is processed.